Northern California remains in a state of chaos as wildfires rip through wine country, leaving smoldering ashes where houses and businesses once stood. According to authorities, hundreds of people are missing or unaccounted for, and more than 3,500 structures have been destroyed in total so far. As the largest group of approximately 20 fires continues to burn unchecked, government agencies and first responders are leveraging satellite imagery to assess the extent of the damage.
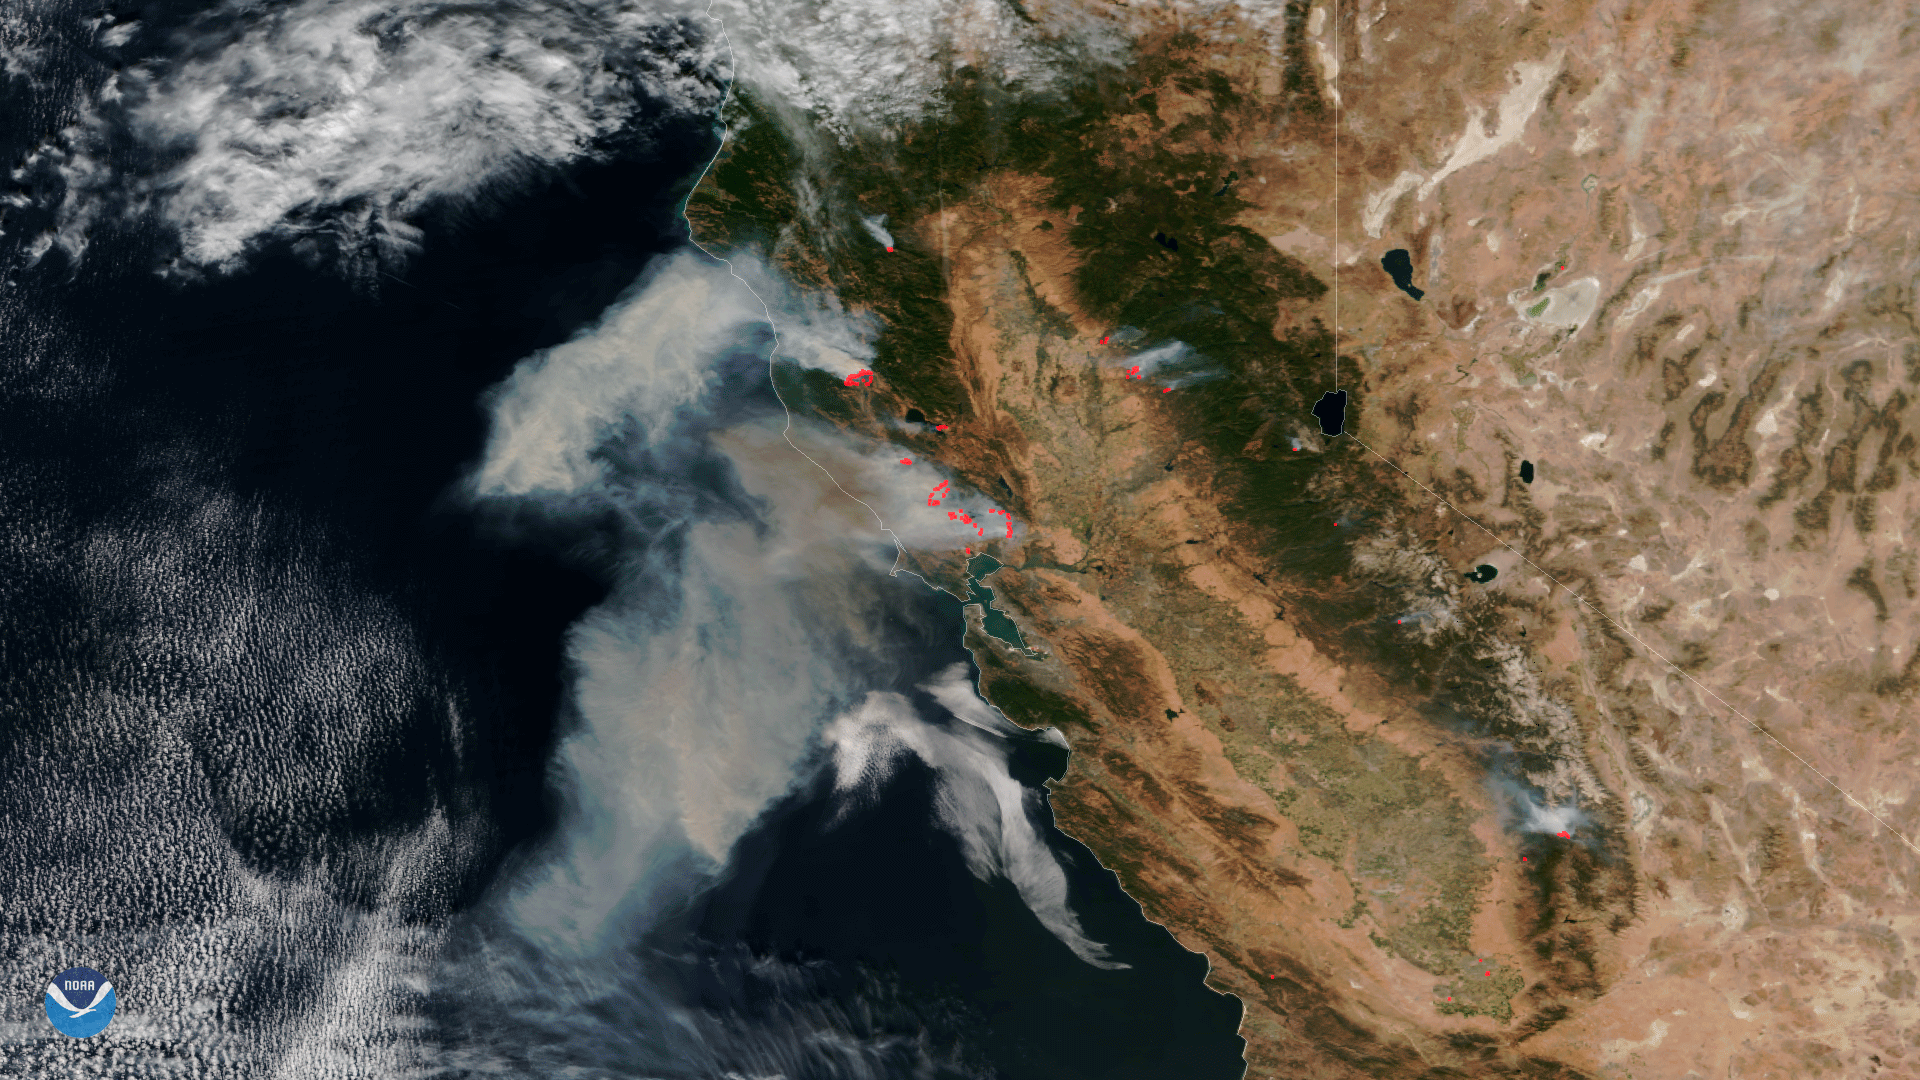
1) Data from the VIIRS instrument aboard NOAA/NASA Suomi NPP satellite from Oct. 9 shows the extent of the fires burning in California. This image combines the satellite’s true color imagery along with thermal imagery (in red) that indicates the hot spots associated with the active fires.
2) This sequence of GOES 16 channel 7 infrared 15 minute images shows wildfire development over 10 hours and 45 minutes starting at 9:45 p.m. PDT, Oct 8. The black areas, along with the transient white pixels, are the heat signatures generated by the active fires and burned areas.

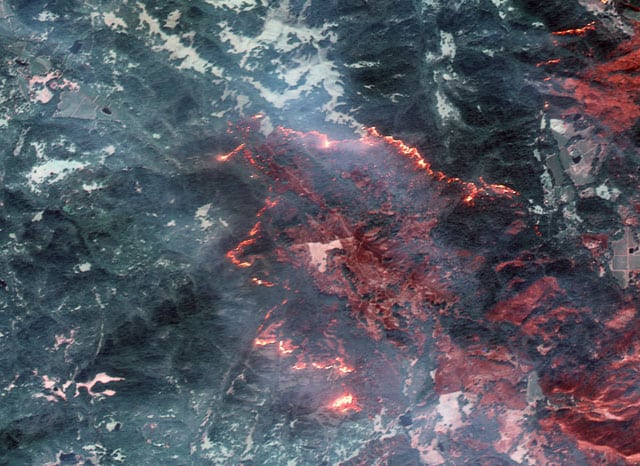
3) DigitalGlobe uses a Shortwave Infrared (SWIR) sensor on its WorldView 3 satellite to penetrate the smoke and detect heat beneath.
4) NOAA’s GOES 16 satellite combines Geocolor (the clouds and smoke in white) and Band 7 (which identifies the fire hotspots in red).
#GOES16 keeping watch on #California #wildfires. @CALFIRE_PIO reporting over 170,000 acres burned. More imagery: https://t.co/eRJpPpx698 pic.twitter.com/vY2xRBuINm
— NOAA Satellites (@NOAASatellites) October 12, 2017
5) The Copernicus Sentinel 3A satellite captured this image of smoke from wildfires in California on Oct. 9.
?#Sentinel3 captured smoke from a recent outbreak of #wildfires in #California as they spread to the Pacific coast: https://t.co/gFdBXGjlVmpic.twitter.com/xGBL5qQQ8w
— ESA EarthObservation (@ESA_EO) October 11, 2017
6) NOAA shares a before/after comparison of areas affected by the wildfires.
Lethal #CaliforniaWildfires ignited and spread quickly. Satellite imagery captures change over just one day. Images: https://t.co/eRJpPpx698 pic.twitter.com/LGa9XGHZ0u
— NOAA Satellites (@NOAASatellites) October 13, 2017